
Market Summary | December 2018
MARKET OVERVIEW
December’s results were mixed for equity markets with large spreads across stock markets globally. Volatility remained elevated throughout December before easing slightly in the final week of the year.
2018 was a year to forget for most markets with many recording the worst year since 2008, the height of the financial crisis. Trade tensions between the United States and China plagued stock markets for much of the year but President Trump has indicated that negotiations are progressing well.
UNITED STATES
The US Federal Reserve begun the month by lifting the target funds rate to a range of 2.25–2.50%. The Fed also marginally lowered the forecast GDP numbers for both 2018 & 2019. The forecast for US GDP growth in 2019 is expected to be between 2.3–2.5%, down from 3% in 2018.
The S&P 500 index dropped to its lowest level since April 2017 but recovered nicely towards the back end of the month. In addition to trade tensions, a standoff between the Trump administration and Congress over both immigration laws and the funding of a border wall has created additional uncertainty in the local market.
The S&P 500 Index (USD) fell 9.18% for the month of December.
ASIA
The one-month hiatus in trade talks provided Asia with an opportunity to catch their breath but not for long. Talks are scheduled to resume at the start of January, as the world watches closely to see if any breakthroughs can be made, or if the US will make good on its threat to impose tariffs on a further US $200 billion worth of Chinese exports.
To negate the impact of trade tensions, The People’s Bank of China cut the reserve requirements for the country’s commercial banks, effectively injecting US $117 billion of liquidity into the economy. Chinese officials have stated that the economy is still likely to reach its 2018 growth target of 6.5%.
The Hong Kong Hang Seng PR Index (HKD) returned -2.49%
The Nikkei 225 PR Index (JPY) returned -10.45%
The Shanghai Shenzhen CSI 300 PR Index (RMB) returned -5.11%
EUROPE
Surprisingly Theresa May survived a vote of no confidence meaning she cannot be challenged as the party’s leader for another 12 months. However, the collective made no further progress on the Brexit front. With March 29 rapidly approaching the chance of a no deal Brexit becomes increasingly likely.
Across broader Europe, the growth picture continues to be clouded by developments in the auto industry, with major car manufacturers having problems certifying vehicles in accordance with the new exhaust and consumption standards.
The UK’s FTSE 100 PR Index (GBP) retuned -3.61%
AUSTRALIA
Australian house prices fell 4.8% in 2018, driven by sharp falls in the Sydney (-8.9%) and Melbourne (-7.0%) markets. Sydney house prices fell 1.8% in December and 3.9% during the quarter, while the fall across all capital cities was 1.3% and 2.8% respectively.
According to the Australian Bureau of Statistics, price falls are now also evident in the middle and lower segments of the market, while auction clearance rates and volumes continue to trend lower. The RBA sees the correction in house prices and the tightening of lending conditions as a healthy development, reducing financial stability risks and potentially prolonging the cycle.
The S&P/ASX 200 Index returned -0.12% through December as Australian shares appeared to show some resistance against the selloffs in larger markets.
Materials (+5.3%) was the best performing sector in December, with BHP (+11.5%) & Rio Tinto (+7.1%) performing well off the back of favourable news flow.
Within the Communications sector (-5.1%) it was a tough month for media, with Nine Entertainment (-21.4%) still struggling after its high-profile acquisition of Fairfax, while Telcos were also in negative territory.
MARKET RETURNS (LAST 12 MONTHS)
Recent performance has pushed Australian Equities into negative return territory whilst returns from International Equities (AUS dollar Terms), Fixed Income & Cash remain slightly positive.
The month of December provided negative returns across equity markets. There is now a significant gap in performance between International & Australian Equities.
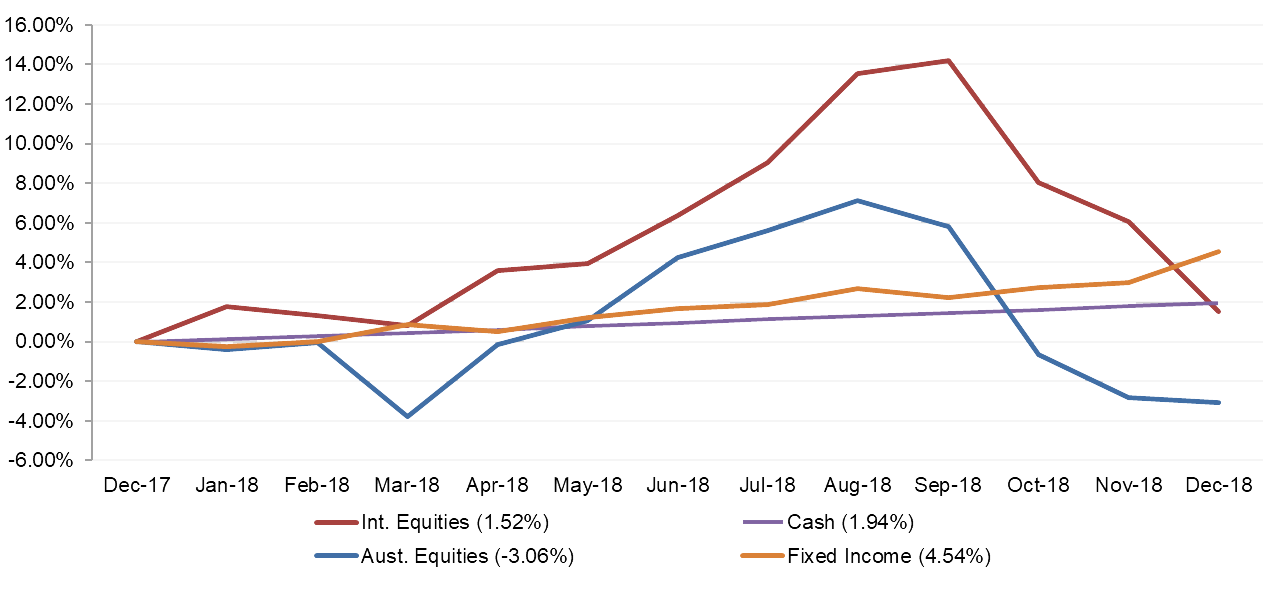
The above graph summarises the performance of the major financial markets and gives you an indication of how these markets performed over the last 12 months. The graph does not reflect your actual portfolio performance.