
Market Summary | September 2019
MARKET OVERVIEW
The major Investment markets rebounded in September following a negative August. In line with the majority of the updates this year, investor confidence grew following some positive developments in the trade war.
Some bad news for the world’s oil supply as drone attacks on two Saudi Arabian facilities put a major dint in the regions production capabilities. The lost production will initially be filled by amounts in reserves however the region remains susceptible to further disruption.
UNITED STATES
The U.S. manufacturing purchasing index came in at 47.8% for the month of September, the lowest since June 2009. In response to the poor result, Donald Trump blamed close friends Jay Powell and the federal reserve for the strong American Dollar.
To counteract this, the Federal Reserve cut the funds rate by 0.25% on the 18th of September, giving the local market some much needed confidence. The Fed Funds Rate now sits at 1.75-2.00% with the Fed not contemplating any further cuts in the near future, much to Donald’s disgust.
From an equity market viewpoint, the market had a solid month with positive returns being received by investors. Apple made news by announcing a streaming TV service, gaming service and launching their new iPhone. Existing streaming powerhouse Netflix was sold down following news of another major player (Apple) entering their space.
The S&P 500 Index (USD) returned 1.72%
The Dow Jones (USD) returned 1.95%
ASIA
The Chinese economy continues to slow. June quarter GDP growth declined to 6.2%, the slowest in 27 years, and there is a risk that it could drop below 6% by the time September’s results are published.
The Bank of China cut the bank reserve requirement ratio for the third time this year, by 0.5% to 13%. This effectively frees up a further 900 billion yuan for lending, which should stimulate the economy.
The regions equity markets progressed in September providing positive returns for the major indices with the Japanese market being a standout performer.
The Hong Kong Hang Seng PR Index (HKD) fell 1.43%
The Nikkei 225 PR Index (JPY) returned 5.08%
The Shanghai Shenzhen CSI 300 PR Index (RMB) returned 0.39%
EUROPE
The biggest news to come out of Europe was the collapse of British travel agency Thomas Cook and in excess of 150,000 people were estimated to be stranded abroad. The company collapsed after the British government refused to bail out the struggling operation.
The European Central Bank (ECB) decided to take action in response to a struggling economy across broader Europe. They announced a restart to quantitative easing from 1st November, purchasing €20bn of debt every month for “as long as necessary”.
European equity markets also posted positive returns.
The UK’s FTSE 100 PR Index (GBP) returned 2.79%
The German Dax (EUR) fell 4.09%
AUSTRALIA
The Australian economy has not suffered a recession for almost 28 years, yet parts of the economy and many economic indicators appear stagnant. Australia’s per capita GDP growth rate for the year to June was -0.2% the worst outcome since the financial crisis. Following this, at the October meeting, the RBA voted to lower the cash rate to a new record low of 0.75%.
From a monetary policy perspective, the likelihood of a 0.50% official cash rate by early 2020 is quite high. The June quarter data shows that core inflation is running at 1.4% and the RBA does not see it reaching 2.0% until 2021.
Despite the headwinds, Australian markets rose 1.84% in September regaining Augusts’ lost ground.
Energy was the top performing sector, returning 4.7% and clawing back some losses from the previous month. The oil price spiked in September, which favoured energy producers like Santos (+7.2%) and Beach Energy (+3.3%).
On the negative side, some high growth names Pro Medicus (-24.42%) and Appen Ltd (-18.33%) fell from their nauseating heights to somewhat return back to reality.
MARKET RETURNS (LAST 12 MONTHS)
Recent performance has pushed the return of Australian equities ahead of International equities. Performance from equities remains in positive territory whilst returns from Cash remain somewhat suppressed.
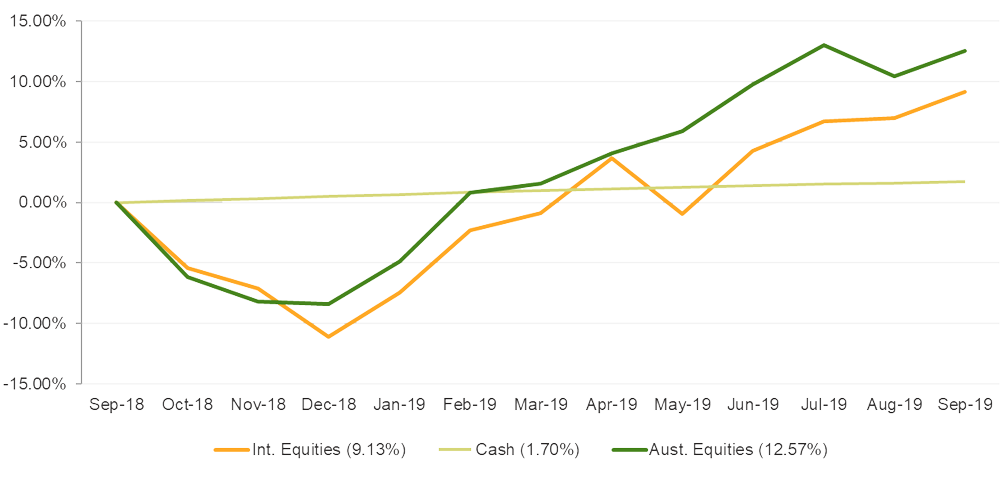
The above graph summarises the performance of the major financial markets and gives you an indication of how these markets performed over the last 12 months. The graph does not reflect your actual portfolio performance.