
Market Summary | September 2024

In the September quarter, the Australian equity market outperformed global peers, driven by strong mining stocks and a boost from Chinese stimulus, while inflation improvements supported expectations of future RBA rate cuts. Global equity markets also rose, benefiting from lower inflation, resilient economic growth, and optimism around earnings, though risks of a recession remain, especially in the U.S. In emerging markets, Chinese stimulus measures led to a strong recovery in equities, with Chinese markets surging in September and overall emerging markets outperforming developed markets for the quarter.
Australia
The Australian equity market outperformed global equities in the September quarter, helped by the surge in mining stocks on the back of the Chinese stimulus package, rising 7.8 per cent to take the year to date gain to 12.3 per cent. Despite losing ground in September, the bank sector managed to rise 8.5 per cent in the quarter while the miners were up 10.8 per cent.
The market was supported by some good inflation data for August where the governments energy subsidies helped bring down electricity costs, resulting in a decline in annual inflation from 3.5 per cent to 2.7 per cent. Core inflation retreated to 3.4 per cent. The improved inflation data saw markets price in up to 100 basis points of RBA easing over the coming 12 months, most likely from early 2025. Although the GDP data for the June quarter showed an economy growing by just 1 per cent over the year and going backwards in per capita terms for the sixth successive quarter, the employment data over recent months has held up better than expected. The economy added 47,500 jobs in August. Together with the recent tax cuts, equivalent to around 1.5 per cent of incomes, the resilient jobs market should provide a floor under the economy and place it in a position to benefit from modest rate cuts in 2025.
The Reserve Bank governor, Michele Bullock, says she does not see interest rate cuts "in the near term" as the central bank waits for clearer evidence inflation is in retreat. The RBA kept its cash rate at 4.35 per cent, the level it has remained at since November 2023. Bullock continues to stress the bank would not hesitate to lift interest rates if inflation veered off its trajectory towards an annual pace of 2-3 per cent.
From an earnings growth and valuation perspective, the Australian market appears challenged. Consensus is for low single digit EPS growth while valuations are stretched in the bank sector, in particular. Market performance is likely to be driven by the interest rate outlook and the prospect for any significant Chinese fiscal stimulus.
United States & Developed Markets
Buoyed by the combination of lower inflation, reasonable economic growth and the prospect of a significant easing cycle, global equity markets rose on optimistic earnings assumptions and PE multiple expansion. For the month the MSCI World ex-Australia index in USD terms rose 1.8 per cent, taking the quarter’s gain to 6.3 per cent and the year to date advance to 19 per cent. With the AUD benefiting from expectations of an aggressive Fed easing cycle, the return in AUD terms was -0.5 per cent for the month and 2.3 per cent for the quarter.
Weak US labour market data for June-July and further progress on inflation prompted markets to price in a higher probability of recession and a cut in the Fed funds rate to 2.9 per cent within 12 months. The Fed finally cut, a larger than expected 50 basis points, and this helped drive the US 10 year bond yield to as low as 3.5 per cent during September. Equity markets seemed to ignore the rising risk of recession, focussing on the solid earnings outlook and the removal of interest rate headwinds on valuations.
The Japanese equity market continued to claw its way back after dropping 21 per cent in the early days of August following the hawkish 15 basis point BOJ tightening in July. For the quarter the Japanese equity market was up 5.7 per cent. The UK rallied almost 8 per cent during the quarter, benefiting from reasonable growth, investor focus on more defensive markets and a rising GBP.
However, the major news towards the end of September was the announcement in China of a range of monetary and fiscal policy measures to stimulate the economy. The package included a 50 basis point reduction in the bank reserve requirement ratio (effectively freeing up 1 trillion yuan for lending), a15-25 basis point cut to several key interest rates, a 50 basis point average reduction in mortgage rates, a reduction in the minimum housing down-payment to 15 per cent, and a swap facility providing 500 billion yuan for funds, insurers and brokers to buy stocks as well as 300 billion in cheap PBOC loans for commercial banks to purchase shares and engage in buybacks. At the time, there was also the promise of a sizeable fiscal stimulus package.
The Chinese equity market jumped by around 24 per cent during September and this helped underpin a 17.1 per cent gain in the Hong Kong market. From a developed market perspective, this prompted a switch towards more cyclical stocks, particularly materials. The global materials sector rallied 4.8 per cent during September and was up 10.6 per cent for the quarter. The German market benefited from the improved sentiment towards China, rising 3.7 per cent in the month. Unusually, at the same time, the utilities sector benefited from lower bond yields, rising 17.6 per cent in the quarter. Banks lost ground in September, as did the energy sector as oil prices remained low. The IT sector rose just 1.5 per cent for the quarter, well behind the utilities, REITs, insurance and materials sectors. From a factor and style perspective the best performers over the quarter were high dividend stocks, Value and cyclicals.
Towards month-end, and in the early part of October, markets turned their attention to rapidly escalating tensions in the Middle East which saw oil prices rise more than 7 per cent to US$76 per barrel. At the same time, a much stronger than anticipated US labour market report for September saw markets push bond yields above 4 per cent and the USD higher, although US equities continued to register record highs.
Emerging Markets
Emerging markets enjoyed their strongest quarterly return since late 2022, buoyed by the Chinese stimulus measures announced in September. Emerging markets rose 6.7 per cent in USD terms during the month, lifting the quarterly return to 8.7 per cent, outperforming developed markets, and the year to date return to 16.9 per cent. In AUD terms the index was up 4.7 per cent in the quarter for a rise of 14.9 per cent this year.
As noted above, in late September Chinese authorities announced a range of monetary and fiscal policy measures to stimulate the economy. The package included a 50 basis point reduction in the bank reserve requirement ratio (effectively freeing up 1 trillion yuan for bank lending), a 15-25 basis point cut to several key benchmark interest rates, an average 50 basis point reduction in mortgage rates, a reduction in the minimum housing down-payment to 15 per cent, and a swap facility providing 500 billion yuan for funds, insurers and brokers to buy stocks as well as 300 billion yuan in cheap PBOC loans for commercial banks to purchase shares and engage in buybacks. At the time, there was also the promise of a sizeable fiscal stimulus package.
With markets having become particularly pessimistic on the scope and appetite for any significant stimulus package to offset the impact of deleveraging in the property market on households and banks, the valuations on Chinese equities had become particularly cheap at under 9 times earnings. The surprise announcement of measures in late September helped send Chinese markets up almost 24 per cent in the month and for the quarter. EM Asia rose 9.5 per cent for the quarter with the Korean market down 5.6 per cent, Taiwan close to flat and India up 7.3 per cent.
Asset Class Returns (last 12 months)
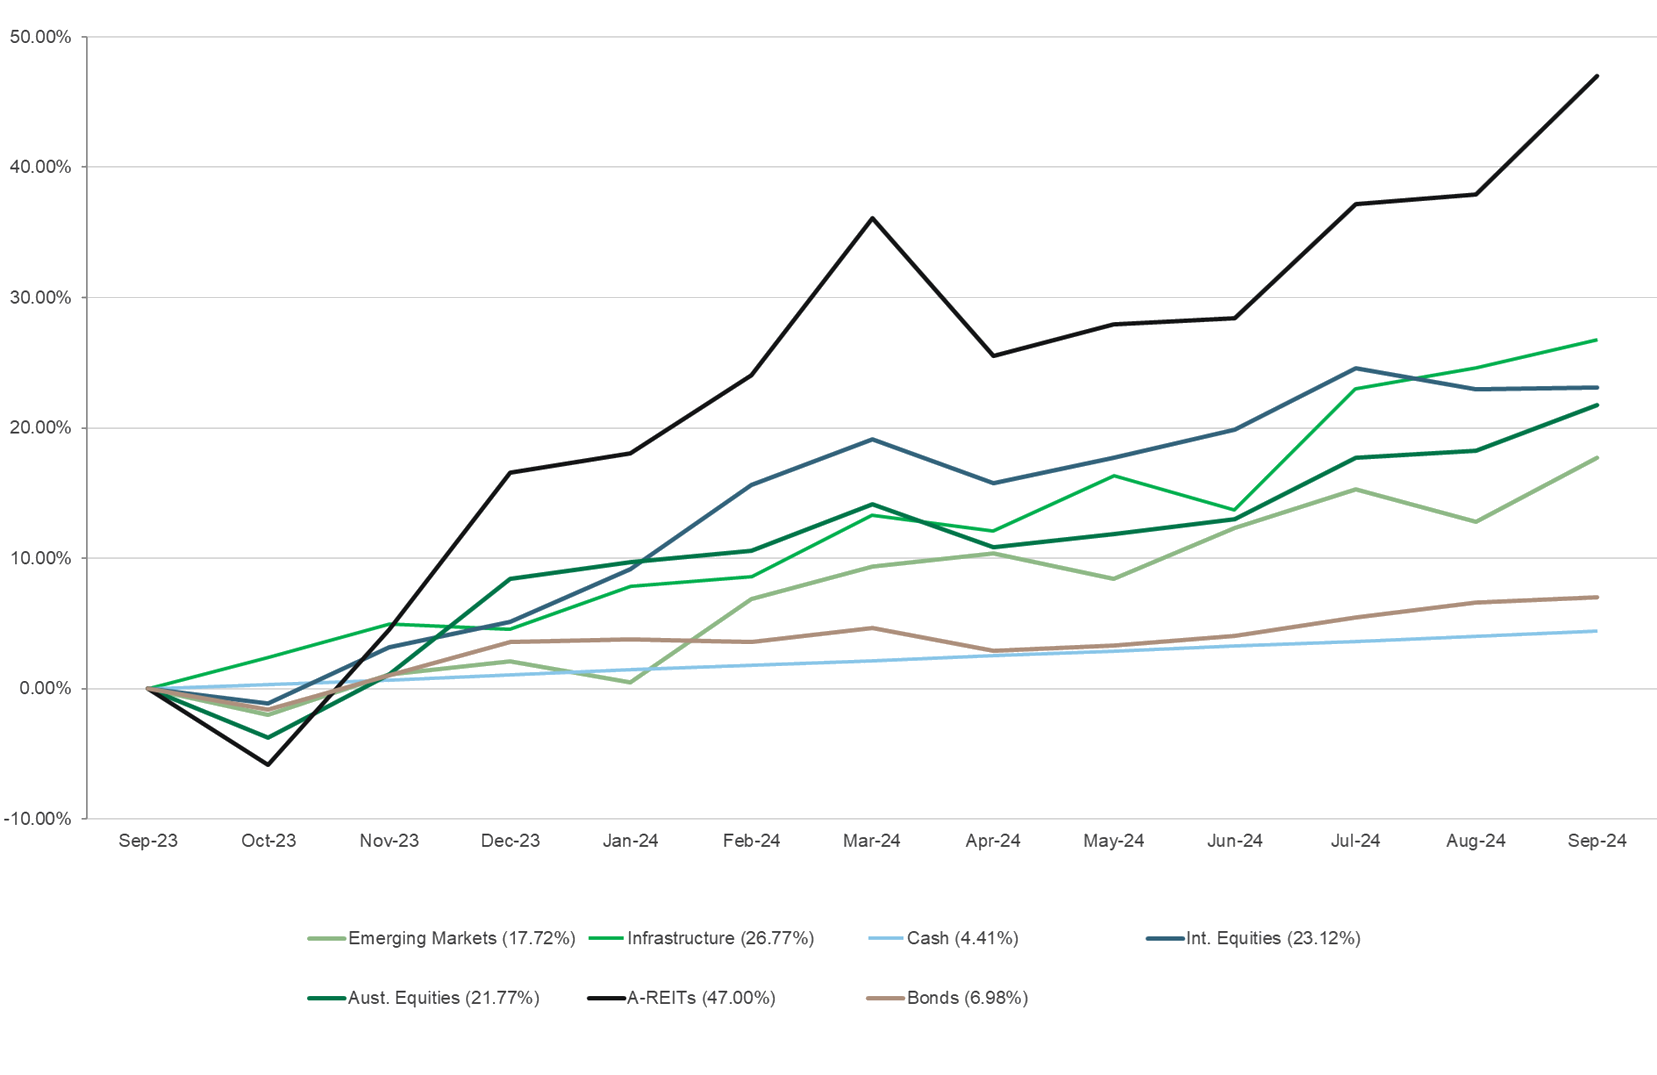
The above graph summarises the performance of the major financial markets and gives you an indication of how these markets performed over the last 12 months. The graph does not reflect your actual portfolio performance.
*Source Zenith Investment Partners