
Market Summary | May 2022
Market Overview
Downward velocity in global markets tempered over the month of May as the war in Ukraine endures & inflation continues to escalate. Continuing lockdowns in China, notably in Shanghai, have had an ongoing impact on global supply chains, especially in the electronics sector.
Investor sentiment continues to be challenged by geopolitical risk and inflation pressures as central banks contemplate the pace and quantum of rate rises required to stem the tide of rising cost of living.

The RBA raised rates for the first time in 10 years due to rising inflation.
United States
In response to the high inflation rate, the US Federal Reserve has raised rates by 0.5%, the most aggressive interest rate increase in over 20 years. The Fed also flagged that further 50 basis point increases are likely to be implemented in the coming months.
Inflation rose 0.3% on April, above the anticipated 0.2%, with the annual rate falling to 8.3% as the impact of rising interest rates start flowing through. Consumer sentiment dropped to 58.4 in May, the lowest figure since August 2011 and below the expected 59.1.
The S&P 500 Index (USD) returned 0.01%
The Dow Jones (USD) returned 0.04%
Asia
China’s trade surplus widened sharply to US$79.76 billion in May, far above market forecasts of US$58 billion.
Shanghai remained under strict lockdown in May, continuing the squeeze on global supply chains, but the lock down is due to lift on June 1.
The Bank of Japan said the country’s economy is projected to grow more slowly, amid headwinds from a resurgence in COVID-19 cases and a rise in commodity prices due to the situation in Ukraine. Japan's annual inflation rate rose to 2.5% in April, marking the eighth month in row of increases, with food prices rising at the fastest pace in 7 years.
Japan remains closed to most international visitors but will open to limited tour groups from June 10.
The Hong Kong Hang Seng PR Index (HKD) returned 1.54%
The Nikkei 225 PR Index (JPY) returned 1.61%
The Shanghai Shenzhen 300 PR Index (RMB) returned 1.87%
Europe
The war in Ukraine continues to put pressure on global food supplies, with an estimated 80 million people in East Africa facing starvation as grain and cooking oil remain stuck in the Ukraine and Russia. Increasing cost of living concerns are impacting consumer sentiment in most developed areas, especially in the USA and UK.
In the UK, GDP decreased by 0.1% in March, with the last 3 months coming in at +0.8%. Inflation rose 2.5% in April, below the 2.6% expected, with the annual
inflation rate rising to 9.0%.
The UK’s FTSE 100 PR Index (GBP) returned 0.84%
The German Dax (EUR) returned 2.06%
Australia
The RBA raised the cash rate to 0.35% in May, the first increase in 10 years, amid rising inflation. GDP grew by 0.8% in 1Q22, above the 0.7% expected, with year over year GDP falling from 4.2% to 3.3%.
The unemployment rate fell to 3.9% in April, matching expectations and coming amid a steady recovery from the pandemic.
The Australian share market finished May 2022 with the S&P/ASX 200 falling sharply by -2.6% and ten out of eleven sectors finishing lower. Specifically, the Materials sector was the only positive sector for the month (+0.1%). The Property (-8.7%) and Information Technology (-8.7%) sectors led the sell-off as persistently higher inflationary figures, geopolitical tensions and tapering fears supressed equities.
The Materials sector outperformance was primarily driven by the Ukraine and Russia geopolitical situation given the significant disruption to supply within commodity markets. The Property sector suffered heavy losses as investors evaluated the commencement of the tightening monetary policy for the first time in over a decade. Likewise, the rout in the Information Technology sector continued as rising interest rates worldwide and potential recessionary fears subdued growth stocks.
Market Returns (last 12 Months)
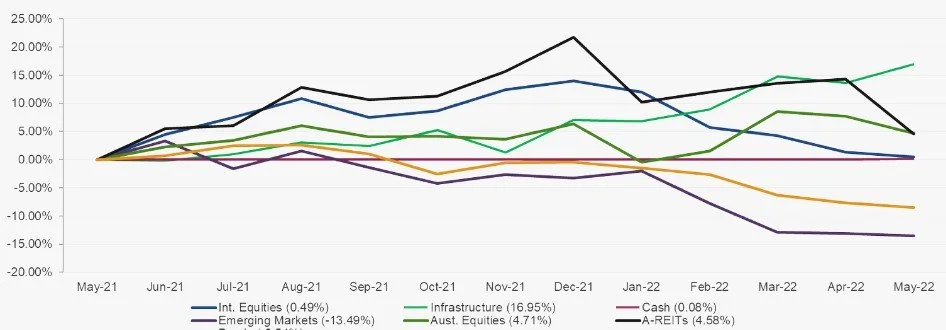
The above graph summarises the performance of the major financial markets and gives you an indication of how these markets performed over the last 12 months. The graph does not reflect your actual portfolio performance.
*Source: Lonsec Research Pty Ltd