
Market Summary | October 2019
MARKET OVERVIEW
Following a positive September, investment markets were mixed in October with US, Japanese and Chinese indices performing well, however markets locally couldn’t mirror the positive performance.
UNITED STATES
The presidential campaigns gathered some more steam in October as Donald Trump prepares to lock down a second term as president. Trump has continued to post strong economic numbers throughout his term, which would traditionally suggest that he would be a shoo-in to take a second term.
With the democrats continuing to push for Trumps impeachment, it is likely that Donald may face some non-traditional political hurdles. Whilst the Democratic party is yet to lock down a spearhead, at this stage it appears likely that either Elizabeth Warren or Joe Biden will lead the campaign. There are however some outsiders such as Michael Bloomberg who have thrown their hat in the ring.
Outside of politics, the US markets had a solid month with both the major indices posting positive numbers. The Federal Reserve cut rates for the third time this year in an attempt to mitigate economical risks resulting from the ongoing trade war.
The S&P 500 Index (USD) returned 3.26%
The Dow Jones (USD) returned 1.68%
ASIA
Market volatility continues to persist within Hong Kong, as the pro-democracy protests continue to weigh on the nation’s efficiency. The nations tourism industry has been decimated across the last few months and shops and public transport systems have been forced into closure within some of the hot spots. Hong Kong has now slid into a technical recession as the nation’s economy has now shrunk for two successive quarters.
China’s third quarter growth rate was released in October, coming in at an annualised rate of 6.0%, the lowest level since 1992. Despite still being high relative to developed nations, the growth rate is now below China’s target of 6.1%. Despite the result, the nation’s equity market still posted a positive result for the month of October.
The Hong Kong Hang Seng PR Index (HKD) fell 5.73%
The Nikkei 225 PR Index (JPY) returned 7.76%
The Shanghai Shenzhen CSI 300 PR Index (RMB) returned 1.60%
EUROPE
Worrying economic data continues to flow out of Germany as the nation’s industrial orders fell more than expected in the September quarter. Given the negative second quarter result, many economists are suspecting that Germany may be in a technical recession.
Yet another Brexit deadline went by the wayside in October, with the deadline now being pushed back until January 2020. The UK will go to the polls on Thursday December 12th with much of the political campaigning expected to be focused around Brexit.
The UK’s FTSE 100 PR Index (GBP) returned 2.79%
The German Dax (EUR) fell 4.09%
AUSTRALIA
The RBA cut interest rates to a record low in October, its third move since June. The aggressive approach taken by the RBA over recent months is partly in response to the global trade uncertainty and the domestic housing sector slowdown.
The government, despite reporting a balanced budget for the first time in 11 years, seems intent on maintaining a strong fiscal position. While commendable for the long term, this stance appears to ignore the opportunity for an expansion of infrastructure spending at a time when borrowing rates are at record lows.
The ASX 200 Accumulation Index returned -0.35%. Healthcare was the standout sector of the market vastly out performing with a return of 7.6%, with giants CSL (+9.6%) & ResMed posting strong results (+7.2%).
Market darling WiseTech Global was down almost 25% in the month of October, following an aggressive pursuit from short sellers throughout the month. The stock has been one of the markets best performers in recent years, but now appears to have much to prove to warrant the hefty price tag.
MARKET RETURNS (LAST 12 MONTHS)
Recent performance has pushed the return of Australian equities ahead of International equities. Performance from equities remains in positive territory whilst returns from cash remain somewhat suppressed.
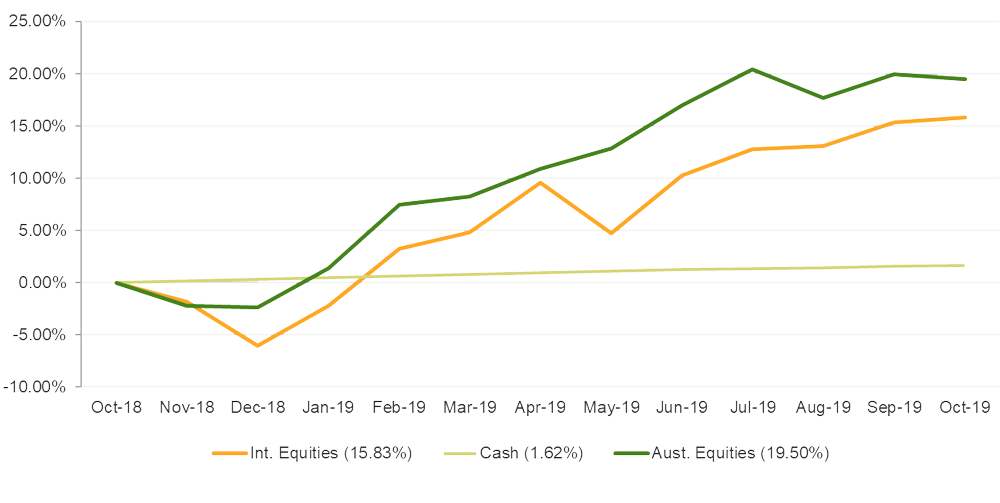
The above graph summarises the performance of the major financial markets and gives you an indication of how these markets performed over the last 12 months. The graph does not reflect your actual portfolio performance.